See every restaurant, from drive-thru to fry station

You know ticket times and daypart sales by the hour. But do you know which rooftop units are at end of life, which drive-thru lanes slow the queue, or how far each restaurant sits from the current prototype? Remity gives operations, development, and franchise teams the same evidence for every location.
Get in Touch Explore Capabilities
Demonstration restaurant Oak & Ember Burgers · Larkspur Crossing
Plano, TX · 40 seats · 1,435 sq ft dining · 1 drive-thru lane
Lane 01 The lot Exterior & Site 6.0 · Drive-Thru 5.5
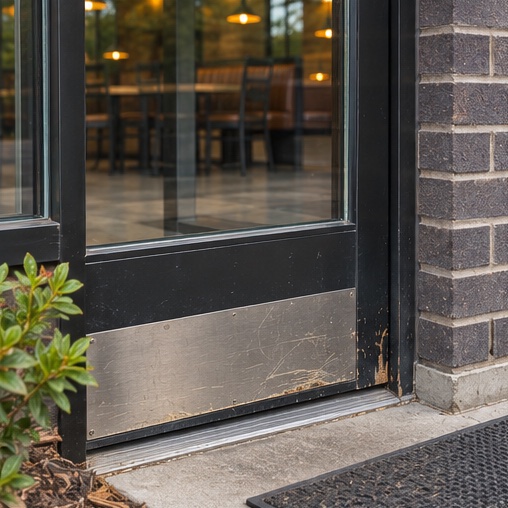
Glazed entrance with a scuffed kick plate and worn threshold
Building entryExterior & Site · Declining 5.0
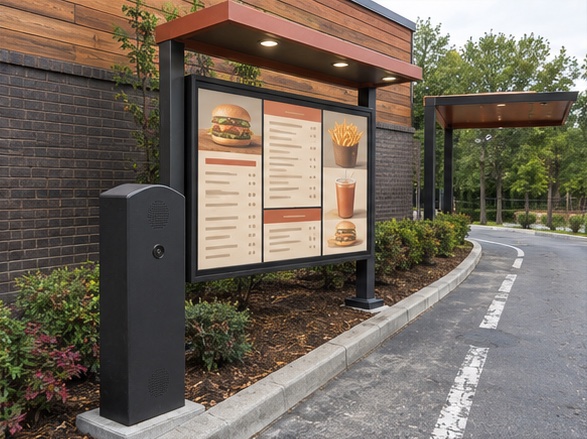
Drive-thru menu board and speaker post beside the lane
Order pointDrive-Thru · Declining 5.0
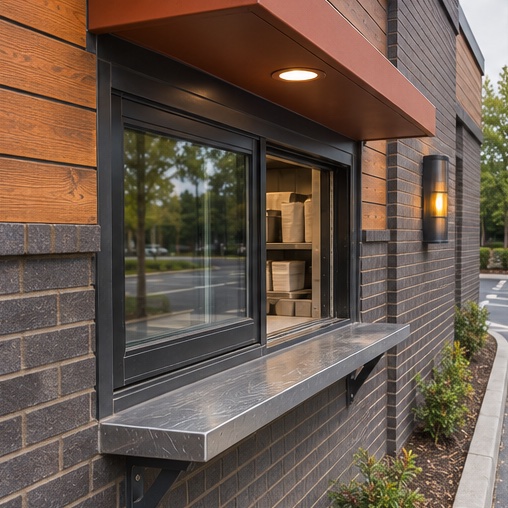
Drive-thru pickup window under a canopy
Pickup windowDrive-Thru · Aging 6.0
Lane 02 Front of house Ordering & Beverage 7.0 · Dining Room 7.5
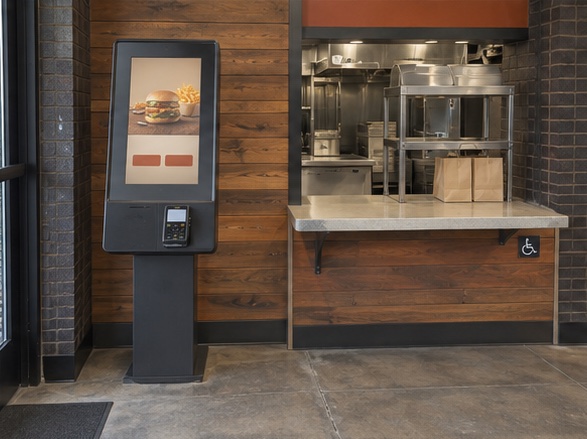
Ordering kiosk beside the pickup shelf
Order displayOrdering & Beverage · Prime 7.5
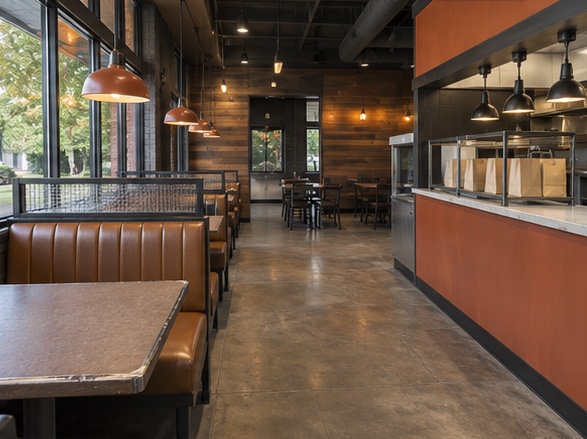
Dining room aisle with booths and pendant lights
Dining floorDining Room · Prime 8.0
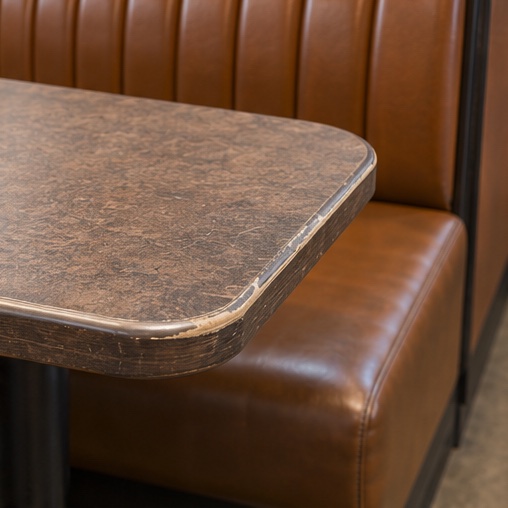
Booth table with a worn laminate edge
Seat banksDining Room · Aging 6.5
Lane 03 Back of house Kitchen 7.0 · Cold Storage 6.0 · Roof 4.5
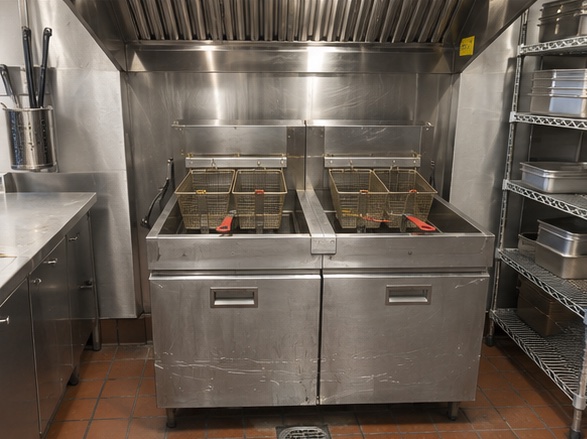
Twin fryers and holding shelves under an extraction canopy
Hot holding stationProduction Kitchen · Prime 7.5
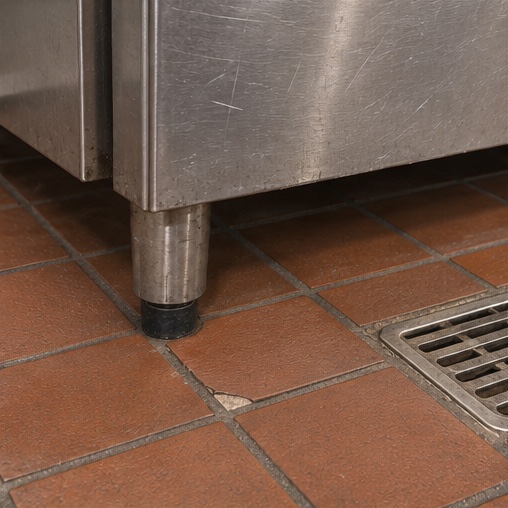
Chipped quarry tile at the base of the fry station
Fry stationCooking Line · Aging 6.5
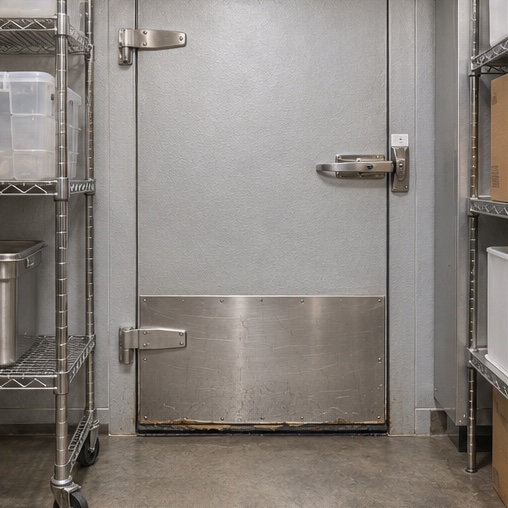
Walk-in cold storage door with a worn lower gasket
Reach-in coolerCold Storage & Support · Aging 6.5
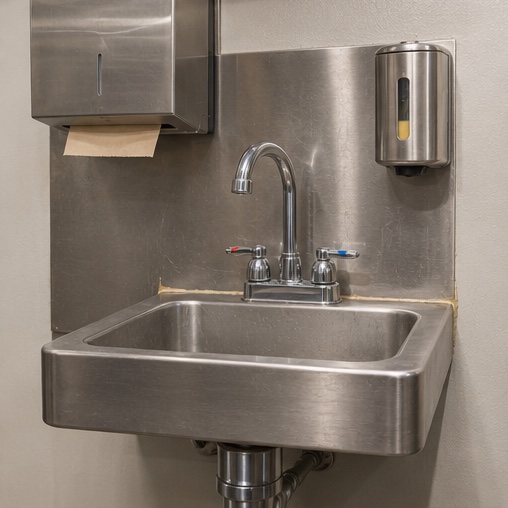
Wall-hung handwash sink with worn silicone at the splashback
Service sinkCold Storage & Support · Declining 5.0
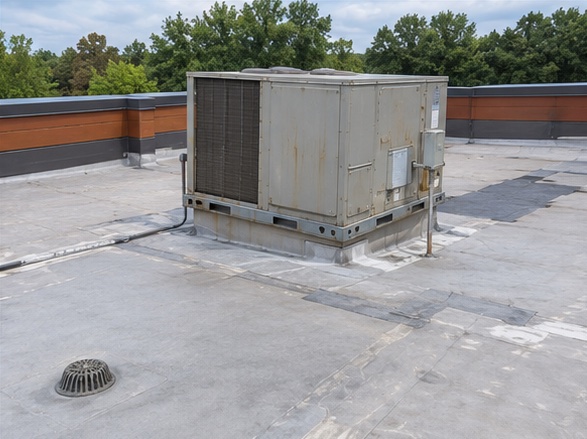
Packaged rooftop unit beside a roof drain
Packaged rooftop unitRoof & Mechanical · End of life 4.0

Eleven of the restaurant's 18 cataloged assets, each scored from its captured view. Scores at 5.5 and below are in blue. Demonstration assessment DEMO-QSR-001; the site is fictional.

The reinvestment problem

Remodel cycles without condition data

What the schedule misses

Reimaging programs run on a calendar. Equipment fails on its own. Most systems carry no record of what is actually in each kitchen, how old it is, or what the last remodel left untouched. Capital gets split between emergencies and mandated scopes, with little left for the work that would move the guest experience.

One record per restaurant

Every restaurant captured, scored, and cataloged—kitchen line, cold storage, dining room, drive-thru, exterior, roof. Operators and franchisors work from the same photographs and the same numbers, so reinvestment conversations start from condition, not opinion.

Equipment and fixtures at Oak & Ember Burgers, Larkspur Crossing · 18 assets by lifecycle stage
End of lifeScores 4.5 and below
1
Packaged rooftop unitRoof & Mechanical4.0
DecliningScores 5.0 to 5.5
4
Order pointDrive-Thru5.0
Service sinkCold Storage & Support5.0
Building entryExterior & Site5.0
Roof drainageRoof & Mechanical5.0
AgingScores 6.0 to 7.0
8
Beverage counterOrdering & Beverage6.0
Pickup windowDrive-Thru6.0
Seat banksDining Room6.5
Prep benchProduction Kitchen6.5
Fry stationCooking Line6.5
Reach-in coolerCold Storage & Support6.5
Drive and parking pavingExterior & Site6.5
Secondary order displayOrdering & Beverage7.0
PrimeScores 7.5 and above
5
Order displayOrdering & Beverage7.5
Secondary dining floorDining Room7.5
Hot holding stationProduction Kitchen7.5
Extraction canopyCooking Line7.5
Dining floorDining Room8.0
Restaurant intelligence

Restaurant intelligence, from the lot to the line

Every capability built for the decisions operators and franchisors face: what to fix now, what to remodel, and what can wait.

01

Kitchen Equipment Lifecycle

Every piece of kitchen, cold-storage, and rooftop equipment cataloged with condition and lifecycle stage. See what is approaching end of life across the network before it takes a restaurant offline.

Assets at end of life, by restaurant41 of 327 across 18 demonstration restaurants
Granite Row · Fort Worth, TX10 of 17
Pine Terrace · Fort Worth, TX7 of 18
Copperwood · Frisco, TX6 of 19
Cedar Harbor · Frisco, TX5 of 18
North Briar · Arlington, TX3 of 20
Maple Bluff · Edmond, OK3 of 20
Sable Creek · Arlington, TX2 of 16
Cinder Grove · Edmond, OK2 of 16
02

Drive-Thru & Guest Journey Scoring

Experience scored stage by stage, from street approach through ordering, dining, and the pickup window. Every low point tied to the assets and photographs behind it.

Guest journey by route · lowest stages in blue
Dine-in and counter
6.0Street Approach
6.0Parking
7.0Ordering
7.5Dining
7.0Counter Pickup
Drive-thru
6.0Street Approach
5.5Drive-Thru Order
5.5Pickup Window
03

Prototype Readiness

How far is each restaurant from the current prototype? Area by area, see what is ready, what needs minor work, and what depends on a full remodel—so reimaging scopes start from the building, not the template.

Readiness for the Oak & Ember Split Flow prototype
Ready
Cooking LineKeep capture equipment clear and serviceable without moving the cooking line.
Minor work
Ordering & BeverageSeparate the ordering, drink and pickup queues.
Roof & MechanicalKeep roof drains clear and the packaged equipment serviceable in place.
Constrained
Production KitchenPlace holding near handoff while keeping crew circulation clear.
04

Tiered Reinvestment Scenarios

Three cumulative scopes for every restaurant, with exact line-item estimates and the projected score for each. Fund work in order and see what a partial budget buys.

Twelve ordered work steps, sized by cost$328,900 for the full Renovation scope
EssentialMaintenanceRefreshRenovation
Site score as the budget reaches each threshold
6.0$0Today
6.5$28,400After the first step
7.0$75,550Six steps funded
7.5$256,400Eleven steps funded
05

Brand Standards Compliance

Condition measured against your own prototype standard in every area. A number for each restaurant, backed by the photograph that produced it—not a walkthrough impression.

Area and prototype standardAlignedCondition
Ordering & BeverageSeparate the ordering, drink and pickup queues.70%7.0
Cold Storage & SupportSeal refrigerated doors and maintain clear service access.60%6.0
Drive-ThruKeep the order point legible from the approach and the curb edge continuous.55%5.5
Roof & MechanicalKeep roof drains clear and the packaged equipment serviceable in place.45%4.5
06

Market & Competitor Context

Trade-area population, corridor traffic, listing ratings, and nearby competitors alongside condition scores. See where a tired restaurant is exposed and where it isn't.

18,673Vehicles a day on the corridor, 2025
17,026Vehicles a day, prior year
27,053Trade-area population
4.0 / 5Listing rating, 145 reviews
Nearby competitors, by listing rating
Morrow Bun House · 1.1 mi4.5 / 5
Pine Ember Burgers · 0.6 mi4.2 / 5
Coppergrain Grill · 1.5 mi3.8 / 5
Ledgeway Chicken · 1.6 mi3.5 / 5

“Cars backed up at the turn during the lunch rush.”

“Pickup was quick and the order screens were easy to find.”

Market figures, competitors and review excerpts are fictional.

Figures come from demonstration assessment DEMO-QSR-001 and Remity's demonstration portfolio of 18 fictional restaurants.
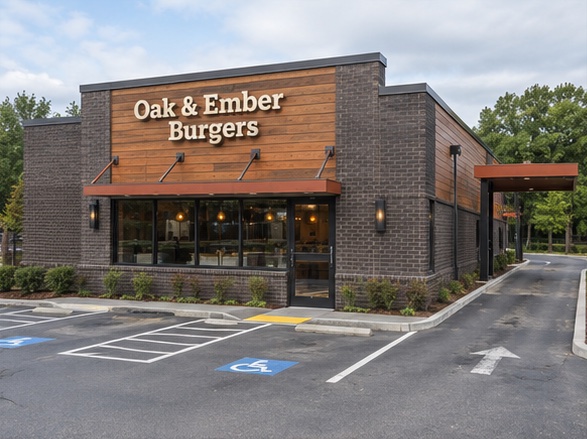
Brick quick-service restaurant with a drive-thru lane, a fictional demonstration site
Get started

Start with one restaurant

We'll capture one restaurant and show you what the data reveals—equipment at end of life, journey low points, and where the next remodel dollar should go.

John Mickey Strategy and Development, Co-Founder

Get in Touch

Send us a message and we'll get back to you shortly.