Your branches tell a story that spreadsheets can't
The branch isn't dying—it's transforming. Advisory centers, digital-first lobbies, drive-thru-heavy suburban formats. Every format decision is a bet on the future. Remity gives you the physical evidence to make those bets with confidence.
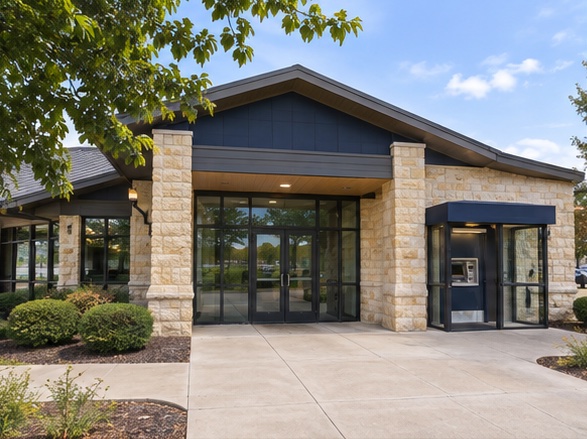
Exterior & Site
6.0 / 10The branch is visible from the corridor. Paving wear is concentrated at the entry.
Keep the entry route legible, continuous and properly drained.
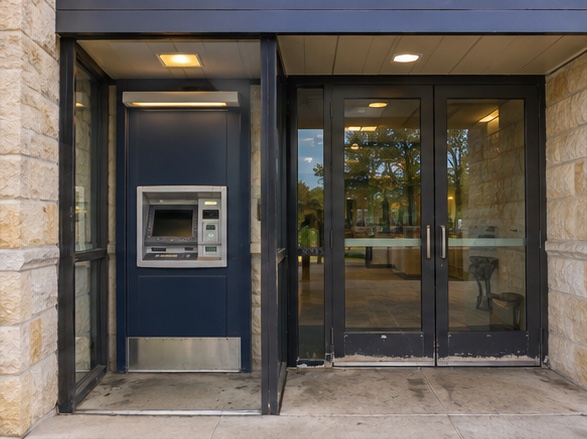
Vestibule & ATM
6.5 / 10The vestibule is simple to navigate. Door hardware and ATM reach need attention.
Keep a clear approach to the self-service equipment.
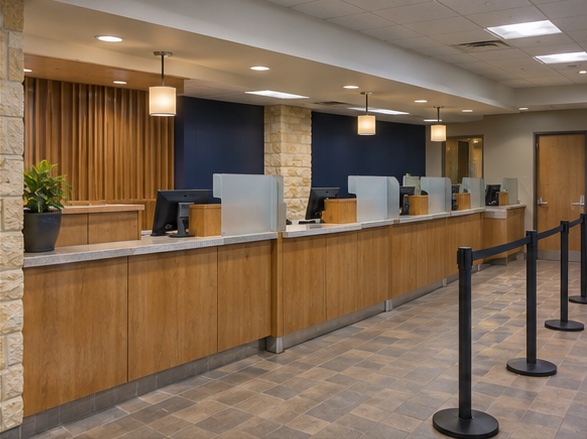
Lobby & Teller Line
7.5 / 10The teller line is visible from the entry. Lighting is uneven near the waiting seats.
Provide an obvious welcome point and even lighting along the client route.

Private Offices
6.5 / 10The office entry is legible from the lobby; partitions limit flexibility.
Provide private consultation rooms with a clear route from the lobby.

Drive-Up
6.0 / 10The drive-up route functions as one lane. Older lighting affects wayfinding at dusk.
Maintain a lit service point and separated pedestrian access.
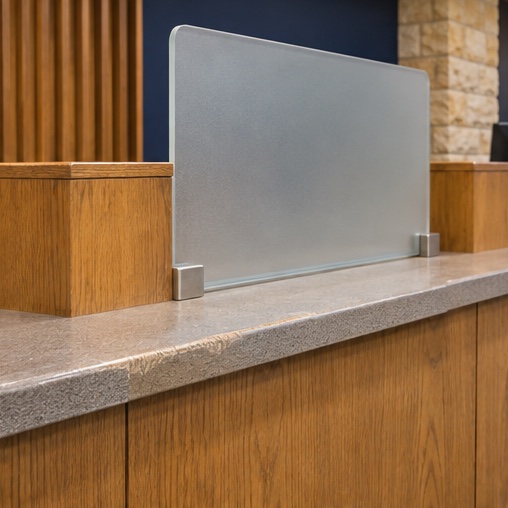
Vault & Secure Areas
7.5 / 10The work area retains separated client and staff routes. A workstation renewal can wait.
Keep cash handling separated from public circulation.
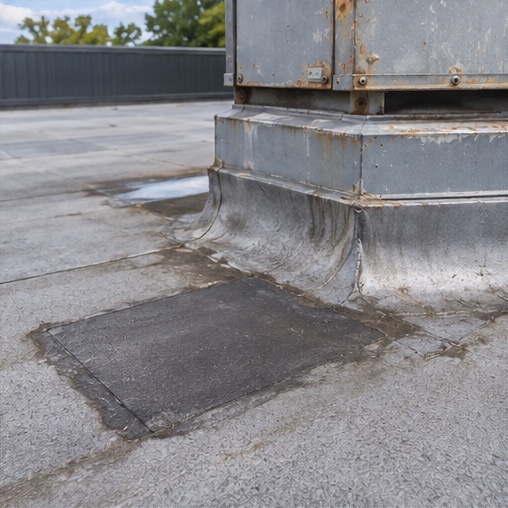
Roof & Mechanical
5.0 / 10The oldest rooftop equipment and roof drainage drive the immediate planning scope.
Maintain roof service clearances and route water away from the exterior.
One branch read room by room, along the client's path. Demonstration assessment DEMO-FIN-001; the site and its figures are fictional.
Banks are redesigning their branch networks for a post-digital world. But the decisions about what to build, where to invest, and what to close are being made without any systematic data on the physical assets themselves.
Format decisions without physical evidence
The format question
Banks are choosing between advisory-first, digital-hybrid, and traditional teller-line formats. These decisions determine capital allocation for years. But format planning relies on market data and lease timelines. Nobody has systematic data on the physical starting point—what exists today, what condition it's in, what transformation would actually cost.
The evidence layer
What does this branch actually look like, room by room? What assets are deployed? How far is it from the target format? What would transformation cost? Remity provides the missing input—physical evidence that turns format planning from a spreadsheet exercise into an informed strategy.
Branch intelligence, room by room
Every capability designed for the decisions branch leaders actually face: where to invest, what to transform, and when to let go.
Network Optimization Modeling
Priority Invest, Protect, Evaluate, Optimize. A four-quadrant framework that maps every branch by market value vs. infrastructure condition—so capital goes where it compounds.
Deposit-Linked Performance
Physical condition scored against FDIC deposit data and fair-share analysis. See where facility investment protects deposits and where deferred maintenance is costing you market share.
Branch Format Assessment
Where does each branch sit on the format spectrum? Traditional teller line, advisory hybrid, digital-first. Quantified gap between current state and target format—so transformation planning starts from reality, not assumption.
Asset Inventory at Scale
331 asset types across security, technology, brand, compliance, and merchandising. Cataloged with condition, coverage, and deployment density per branch—searchable across the entire network.
Brand Alignment Scoring
Quantified compliance with current brand standards. Not a subjective walkthrough—a percentage, measured across signage, fixtures, and finishes at every location.
Client Journey Mapping
Experience scoring from parking arrival through lobby, teller, consultation, and exit. Every touchpoint measured, every friction point identified with spatial evidence.
Network figures come from Remity's demonstration portfolio of 18 fictional branches.

Start with one branch
We'll walk you through a sample branch assessment—format scoring, deposit-linked performance, and investment modeling—using your own network data.