Retail Physical Intelligence

See your brand shine in every store

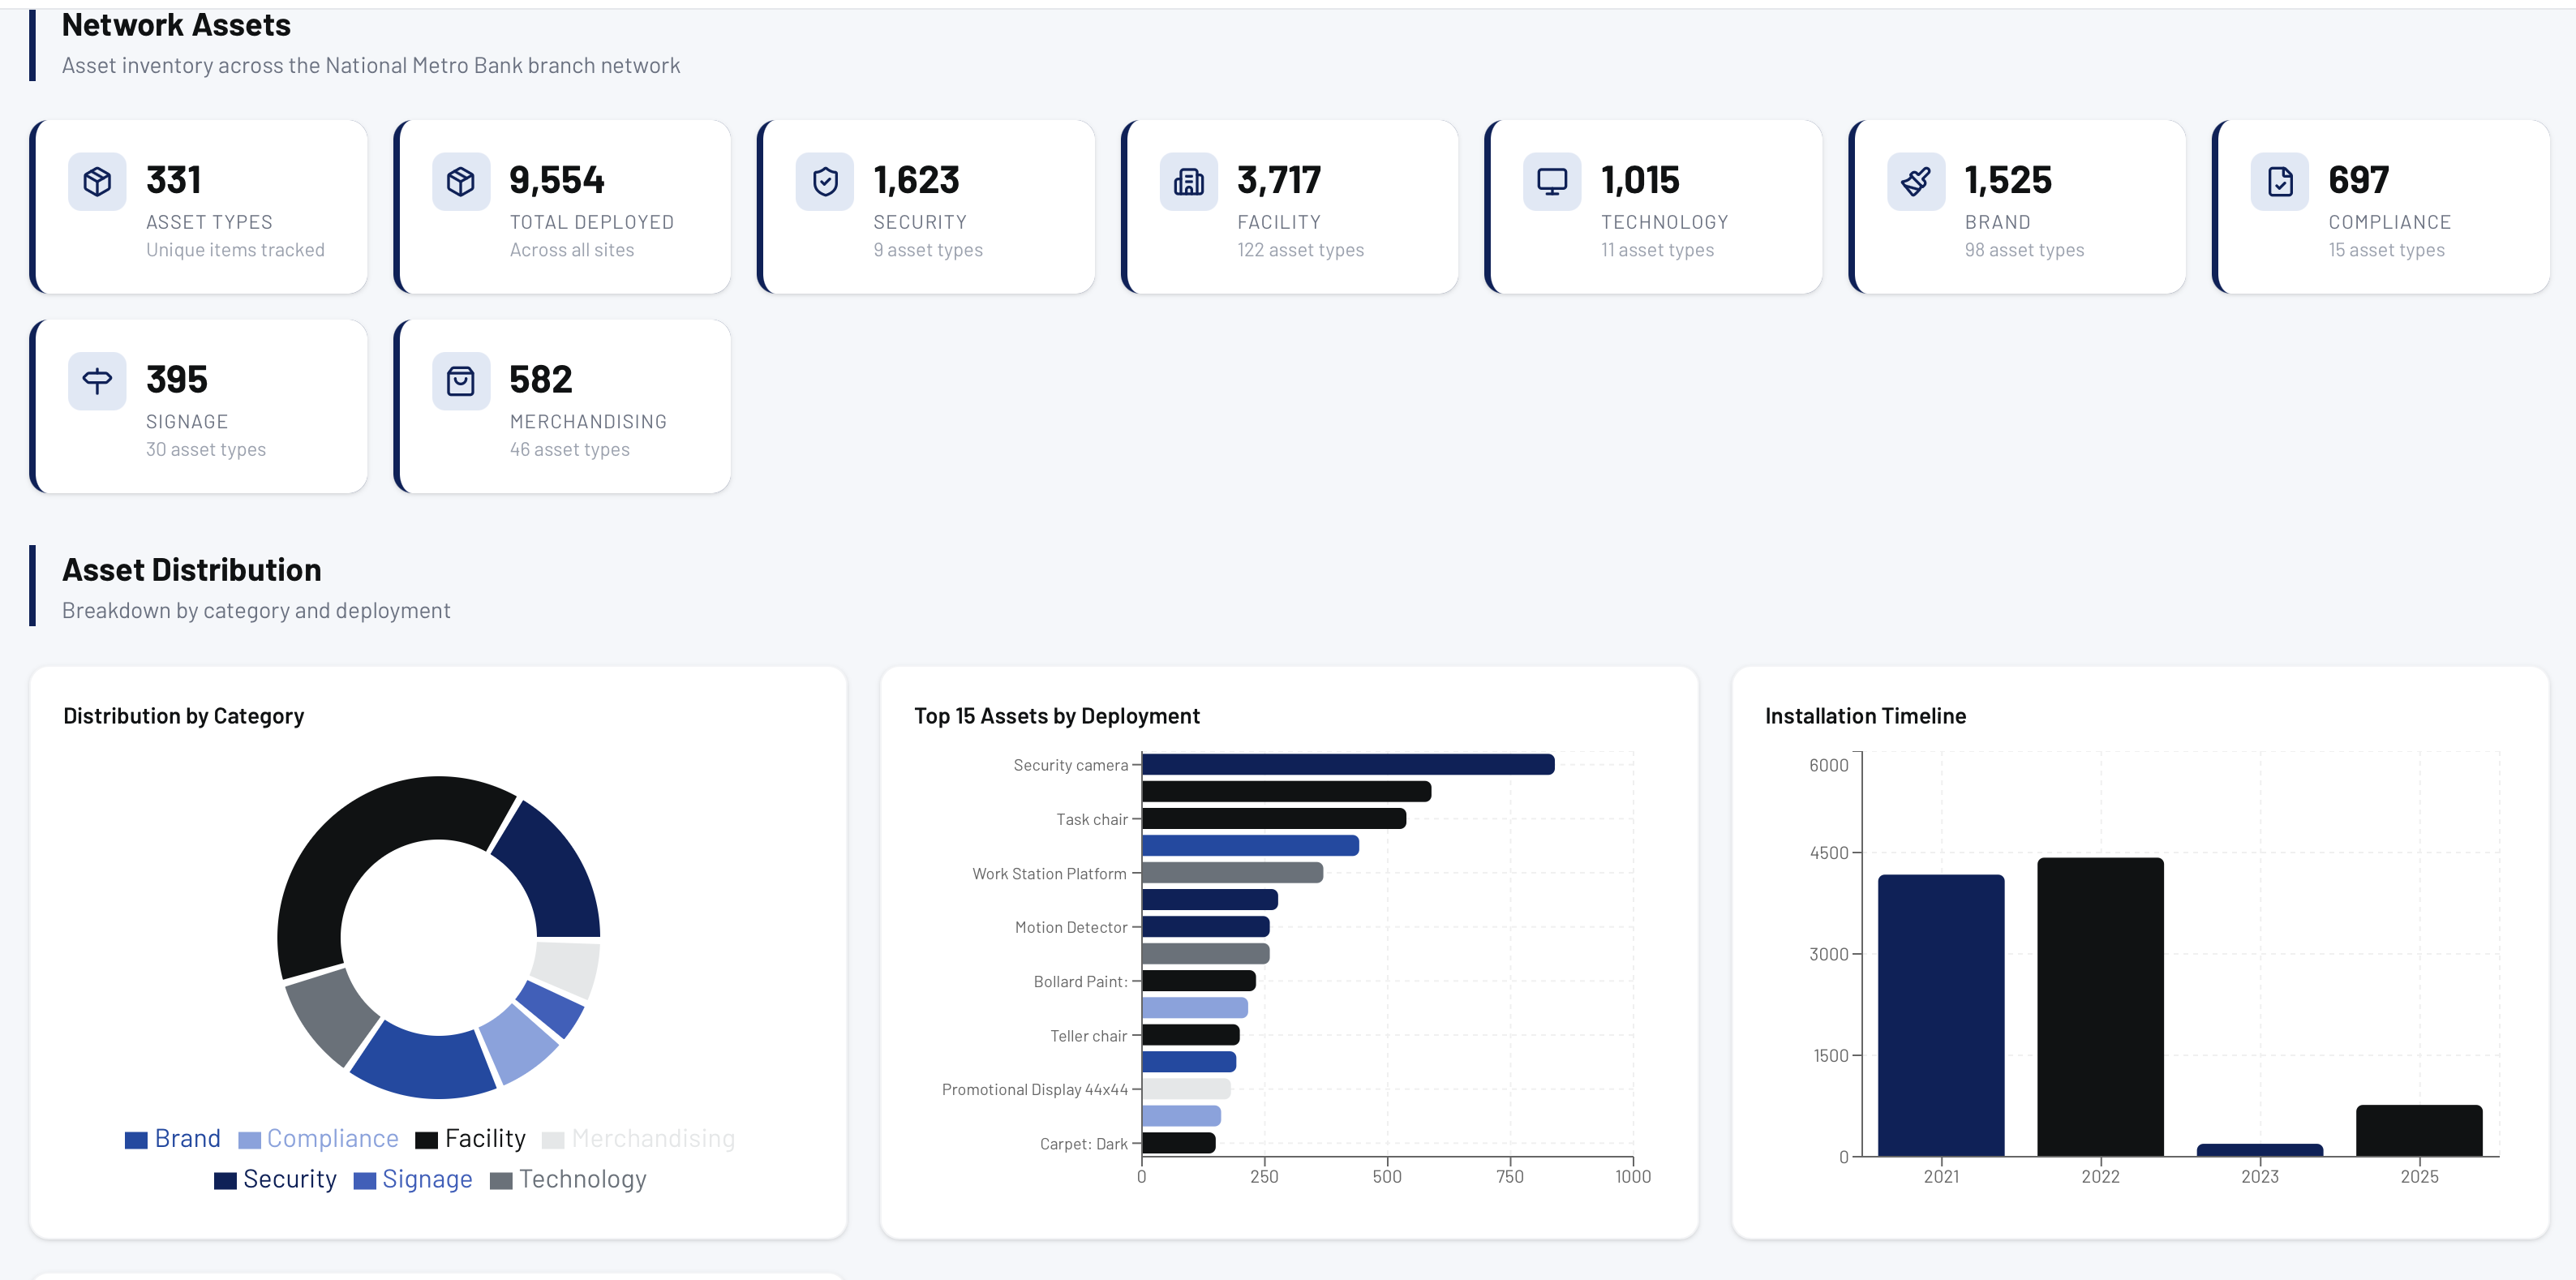
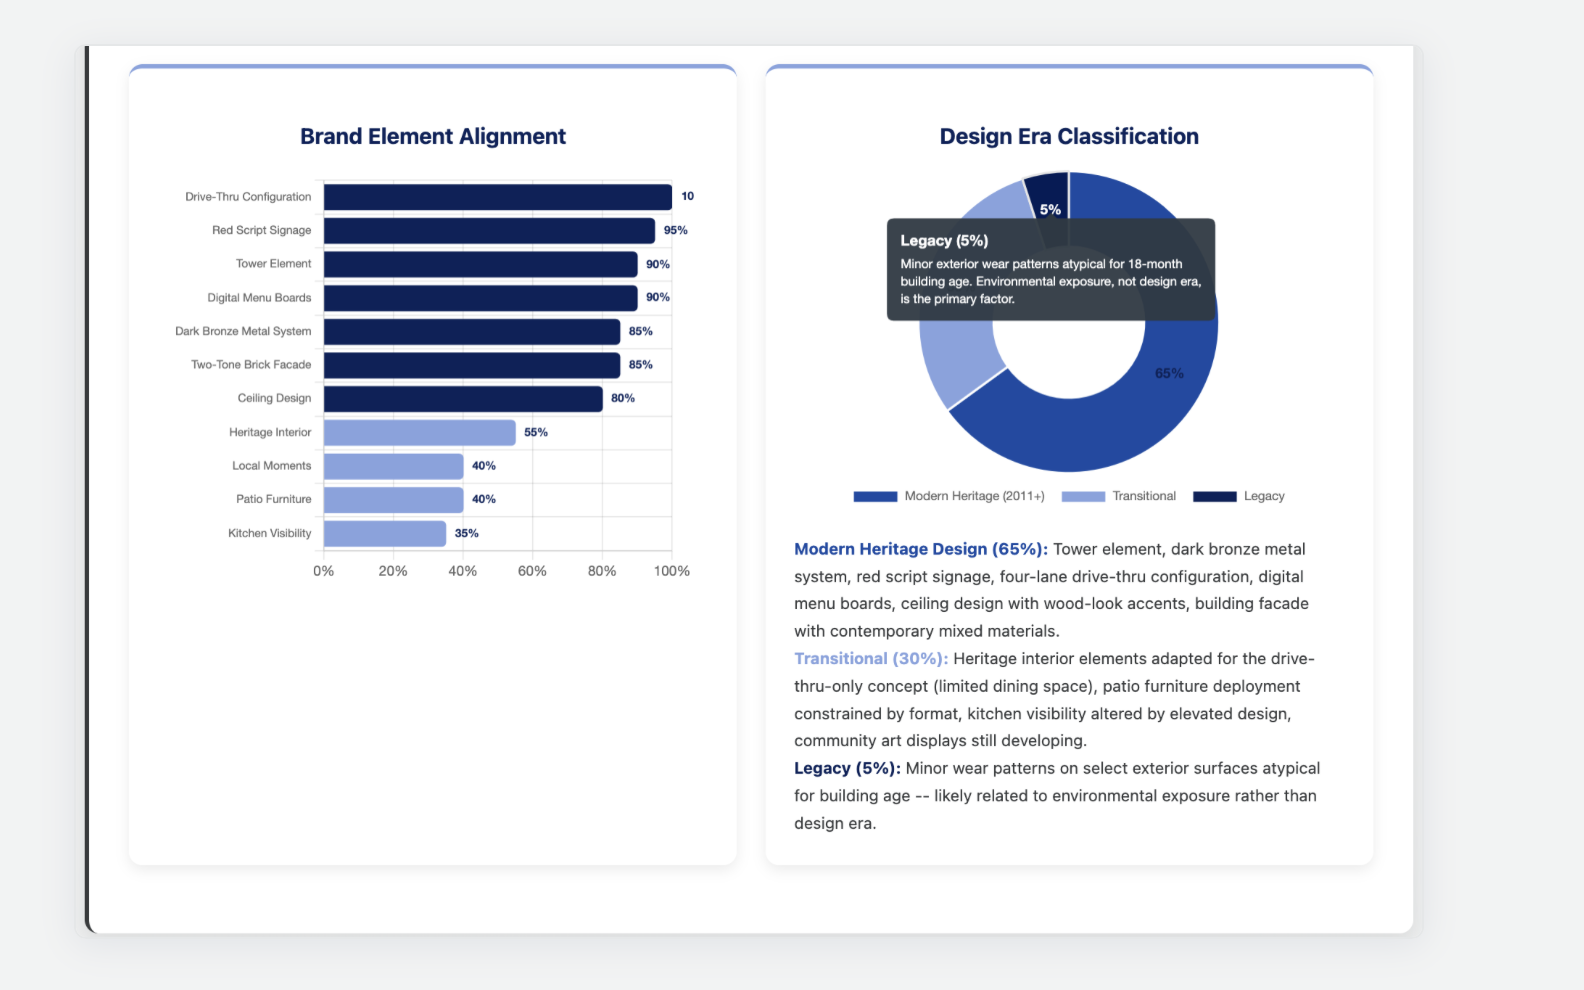
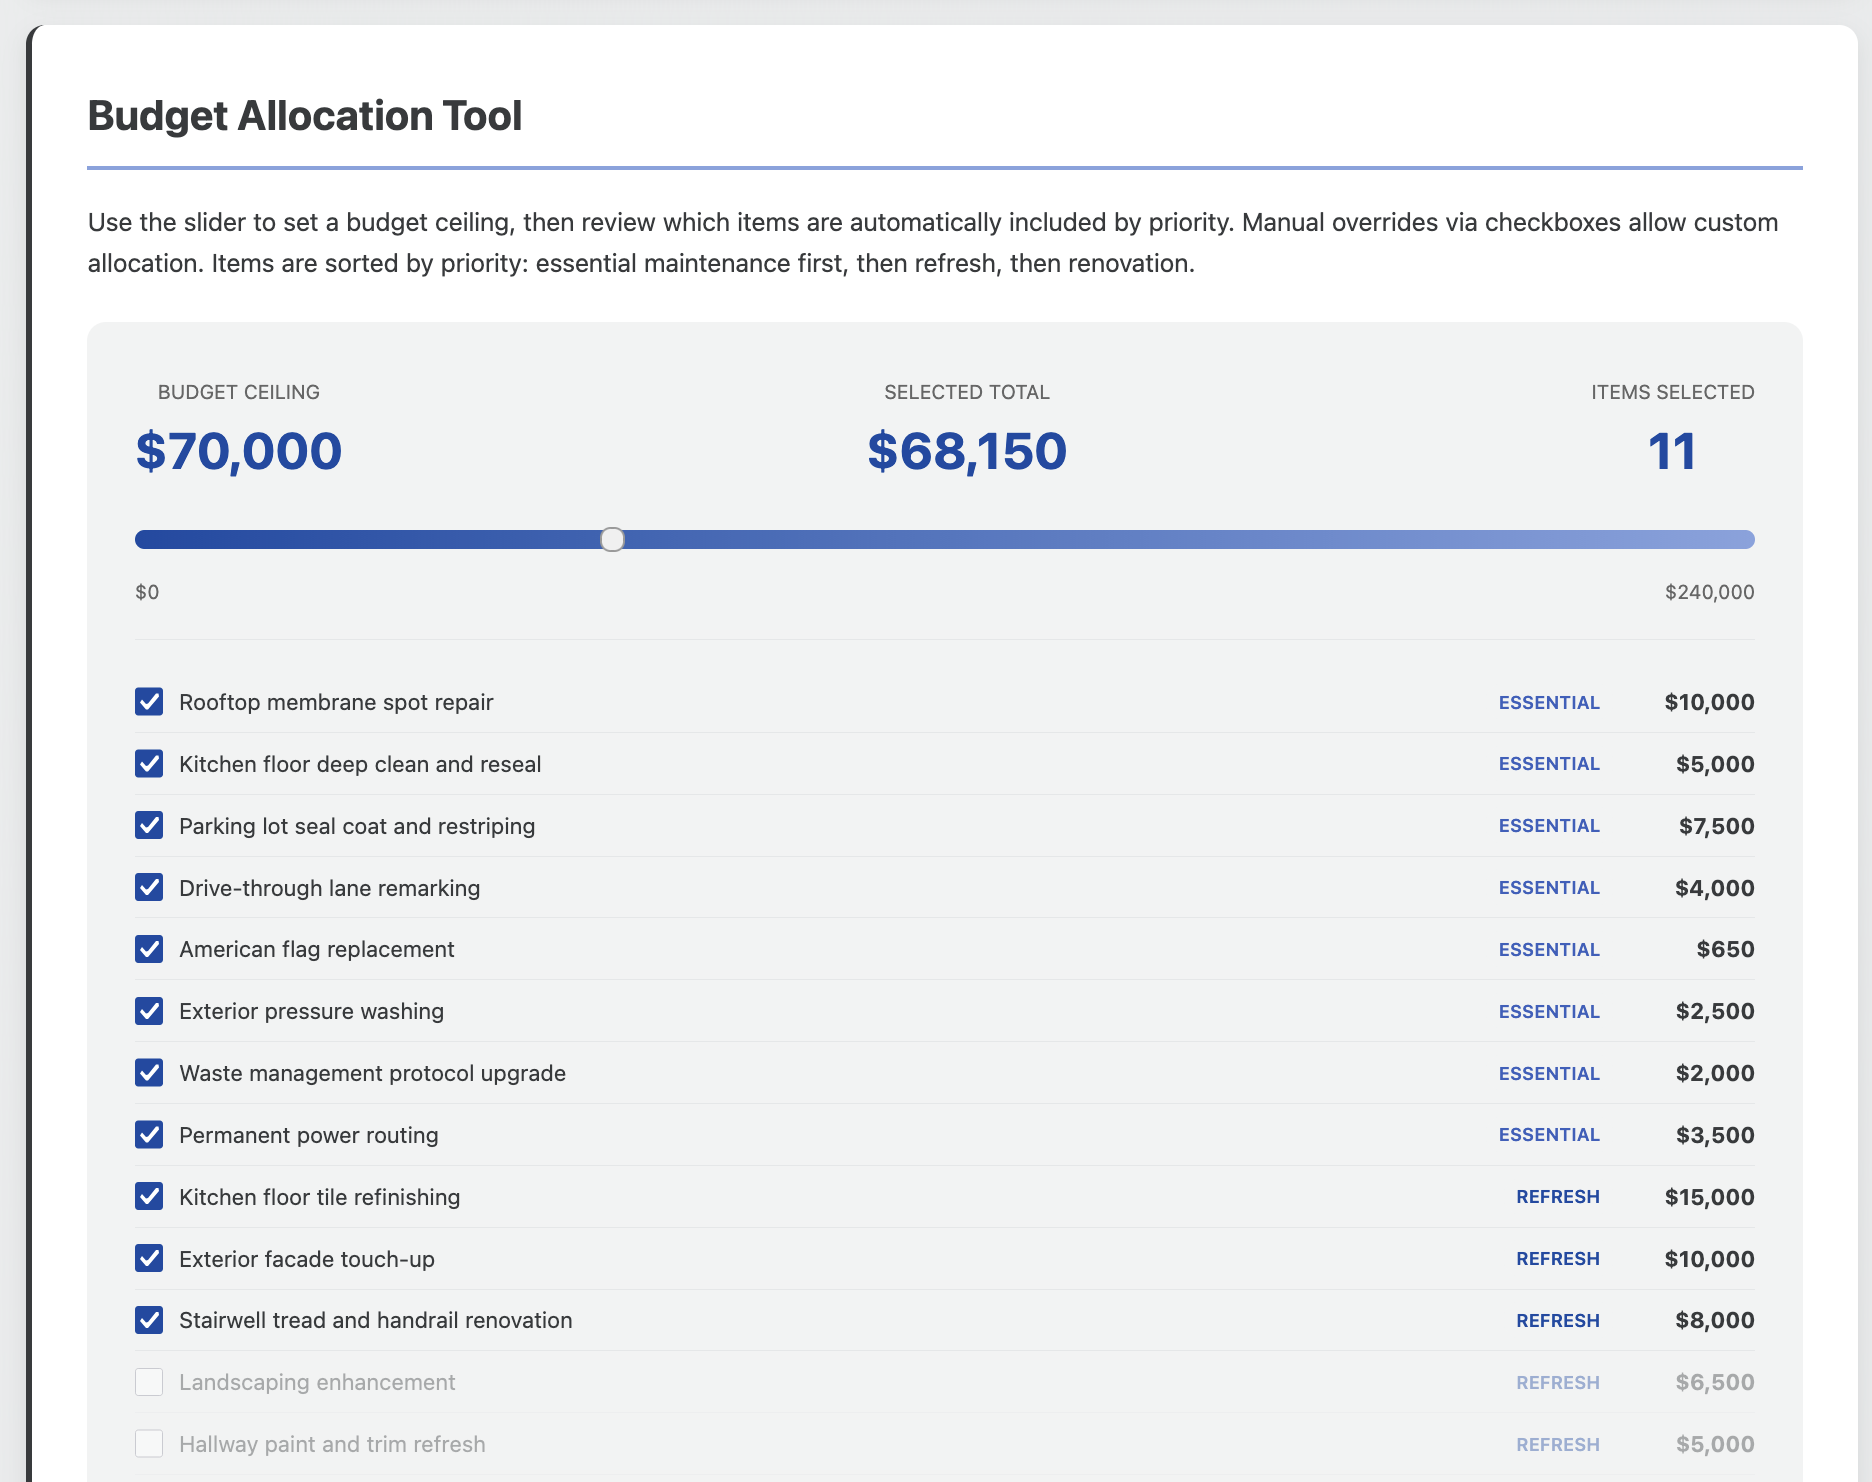
You know your same-store sales to the penny. But do you know which locations have aging equipment, how many stores match current brand standards, or where last year's refresh is already showing wear? Remity gives operations and brand teams portfolio-wide visibility into the network.

Network Assets dashboard showing 331 asset types, 9,554 items with distribution by category, deployment, and installation timeline
The consistency problem
Hundreds of locations, zero baseline
Brand Element Alignment scoring and Design Era Classification showing Legacy, Transitional, and Modern design breakdowns

What you don't know

Most retail portfolios have no systematic record of what's actually in each store. Equipment ages out silently. Brand standards drift between refreshes. Regional managers flag what they notice, not what matters. The result: capital allocated by urgency instead of impact.

A single source of truth

Every store scanned, scored, and cataloged. Equipment condition tracked across the network. Brand consistency measured store by store. Maintenance needs surfaced before they become emergencies. Capital goes to the store where the investment compounds.

Portfolio operations
Know what you have — everywhere

Every capability built for the operational reality of managing hundreds of locations with limited visibility.

Overall Brand Alignment scoring at 72% with element-by-element design standard comparison

Asset Inventory & Lifecycle Tracking

Track key fixtures, pieces of equipment, and branded elements cataloged across your network. Aging curves, replacement forecasting, design era breakdown—know what's approaching end-of-life before it fails.

Maintenance Prioritization

Condition scoring by zone: sales floor, checkout, back-of-house, receiving, parking, exterior. Surface-level degradation detected and flagged with 3D evidence before it escalates.

Brand Consistency Measurement

How many stores actually match the current brand standard? Measured to the percentage point. Signage, fixtures, finishes, and merchandising—store by store, across the entire portfolio.

Competitive Context

Proximity analysis for adjacent competitors. Overlay condition scores with market exposure to see where underinvestment creates vulnerability—and where it doesn't matter.

Refresh ROI Baseline

Capture condition before and after a refresh. For the first time, measure whether a remodel moved the needle—and by how much. Build an evidence base for future investment cases.

Capital Allocation Matrix

Market value vs. infrastructure condition. Prioritize by impact, not by who asked loudest. Four-quadrant framework that makes portfolio-level trade-offs visible.

Get started
Pick three of your most challenging markets

We'll capture a handful of stores and show you what the data reveals—maintenance gaps, consistency drift, and where your next refresh dollar should go.

Ryan Highfill

Product, Co-Founder

John Mickey

Strategy and Development, Co-Founder